Signs Your Data Is Quietly Hurting Your Growth
TL;DR
The Problem: Between 60% and 73% of all data within an enterprise goes unused for analytics, while poor data quality costs companies an average of $12.9 million annually
Key Warning Signs: Teams avoid your dashboards, different departments show conflicting numbers, and decisions still rely on gut feelings
The Solution: Transform scattered data into plain-English insights that actually guide business decisions.
Quick Win: Start asking your data simple questions in natural language instead of wrestling with complex dashboards
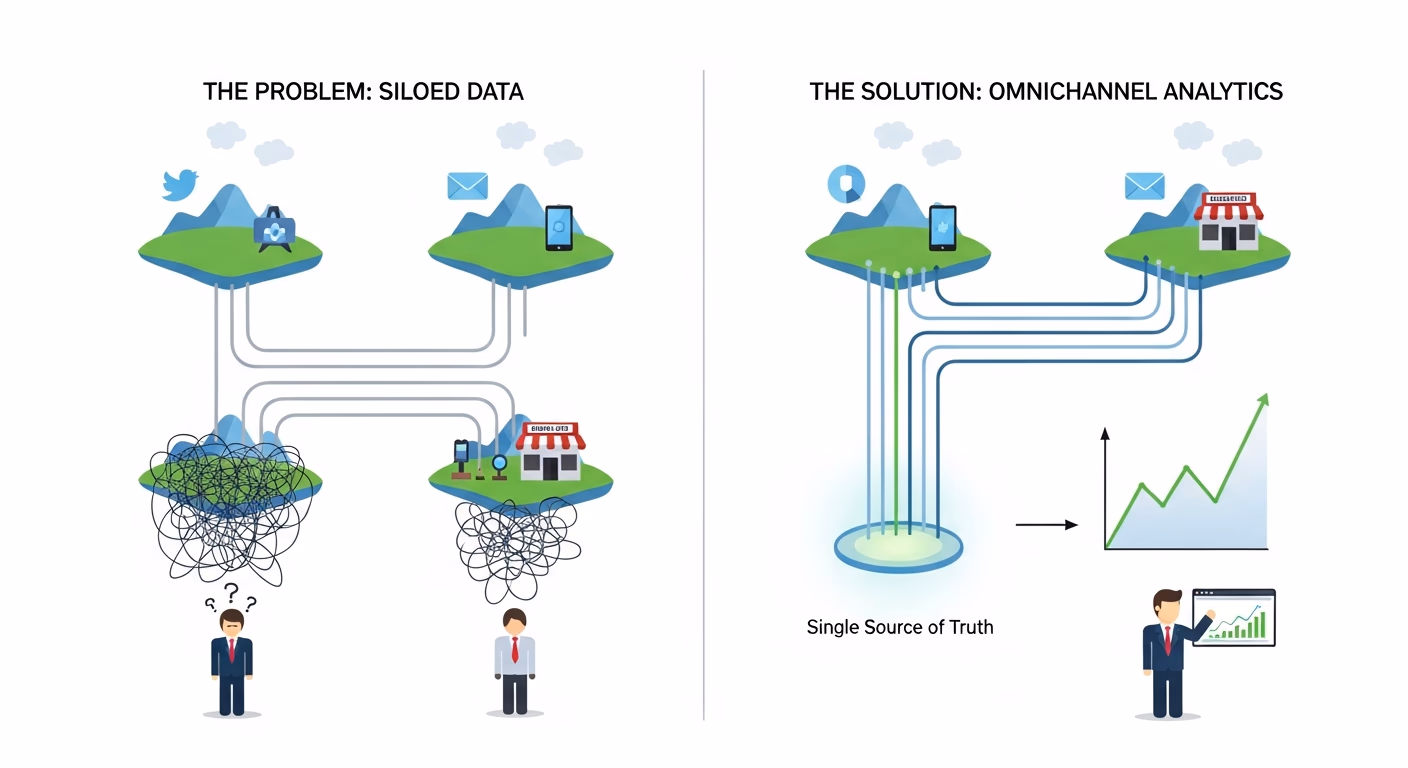
Omnichannel analytics transforms fragmented data from multiple channels into a single, unified view of the customer journey.
Data-driven growth should accelerate your business. Instead, for many omnichannel retailers, analytics become a silent growth killer.
Between 60% and 73% of all data within an enterprise goes unused for analytics, while companies spend an average of 2.5 hours daily searching for insights that should take minutes to find. Meanwhile, competitors with streamlined analytics capture market opportunities faster.
In Southeast Asia's competitive retail landscape, this data dysfunction is especially costly. You're fighting for market share against both local innovators and global giants — all while your team debates which dashboard shows the "real" numbers.
Here's what you'll discover: the specific warning signs that your data strategy is backfiring, why expensive analytics tools often create more problems than they solve, and practical steps to transform scattered information into growth-accelerating insights that business teams actually use.
Why Data Can Become Your Growth Enemy
Most leaders invest heavily in analytics with the expectation of accelerating business growth. Instead, they often inadvertently create new, complex problems that stifle it. This paradox arises from two common fallacies.
The "More Data = Better Decisions" Myth
Adding more data sources — from Google Analytics to your CRM and social media platforms — doesn't automatically lead to better data-driven decision-making. Without a proper integration strategy, it often creates the opposite effect:
- Analysis Paralysis: Teams spend more time trying to gather and reconcile data from different systems than they do acting on the insights.
- Conflicting Truths: Multiple, unverified "sources of truth" lead to conflicting reports and internal disagreements, derailing strategic conversations.
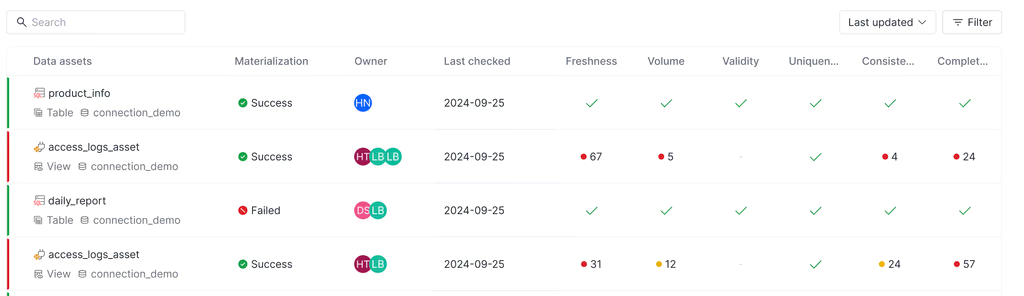
- Technical Barriers: Complex dashboards and analytics tools require specialized training, creating a bottleneck where only a dedicated Data Scientist or analyst can interpret the information.
The Technical Debt Problem
Every new analytics tool, marketing platform, or data source you add creates significant integration challenges that accumulate over time:
- Data Silos: Information becomes trapped within individual platforms that don't communicate with each other, preventing a holistic view of the customer journey.
- Manual Consolidation: Teams are forced to manually export data into spreadsheets — an error-prone and time-consuming process that undermines data quality.
- Outdated Reports: By the time data is manually compiled and analyzed, it's often outdated, making it useless for capturing Real-Time Insights into changing market conditions.
If you only remember one thing: More data tools do not equal better insights. The goal is accessible, actionable intelligence that empowers your entire organization.
The Hidden Costs of Bad Data Decisions
A flawed data strategy doesn't just waste time — it actively erodes your bottom line by misdirecting resources, alienating customers, and obscuring valuable opportunities.
Revenue Impact
Poor data decisions, stemming from an incomplete view of your business, create tangible financial losses that compound over time:
- Inventory Mismanagement: Overstocking slow-moving products while popular items go out of stock because you can't connect online demand signals with physical store inventory.
- Marketing Inefficiency: Wasting budgets on low-performing channels or campaigns because you can't accurately attribute conversions across the entire customer journey.
- Customer Churn: Failing to notice the early warning signs of disengagement — like a drop in app usage combined with fewer store visits — because the signals exist in separate data silos. This directly impacts Customer Satisfaction and retention.
Missed Opportunities
Perhaps the greatest cost is the opportunities you never see. According to IDC research, knowledge workers spend 2.5 hours daily searching for information. A fragmented view of data means you are blind to emerging trends and patterns that could fuel growth:
- Untapped Customer Segments: Missing the chance to identify a niche group of customers who interact on social media and are prime candidates for a new premium product line.
- Product Development Miscues: Lacking the integrated Customer Feedback needed to inform effective Product Development and innovation cycles.
- Suboptimal Pricing: Failing to understand the price sensitivity of different customer segments across various channels, leaving money on the table.
7 Warning Signs Your Data Strategy Is Backfiring
1. Your Team Avoids Using Analytics Tools
The Sign: Decisions are still made based on gut feelings or anecdotal evidence rather than by consulting your expensive analytics platform. Research shows that 58% of companies base at least half of their business decisions on experience rather than data, indicating a deep-seated distrust or difficulty in using available tools.
Why it happens: If extracting insights requires deep technical expertise or navigating a convoluted user interface, business teams will naturally revert to familiar, less-data-driven methods. The tools are seen as obstacles rather than enablers.
The hidden cost: You're paying for powerful analytics tools that have zero influence on your day-to-day marketing strategies and operations, rendering the investment worthless.
2. Different Departments Quote Different Numbers
The Sign: Your sales team reports a 15% increase in conversions from a recent promotion, but the marketing team's Google Analytics account shows only an 8% lift for the same period.
Why it happens: This is a classic symptom of data silos. Each department pulls data from its own preferred system (CRM, marketing automation, e-commerce platform) without a unified definition for key metrics. This creates multiple, conflicting versions of the truth.
The hidden cost: Strategic meetings devolve into arguments about whose numbers are "correct" instead of focusing on collaborative growth planning. Trust in data erodes across the organization.
3. Reports Take Days to Generate
The Sign: An executive asks a seemingly simple question, "How did our latest email campaign impact in-store traffic last weekend?" and the response is, "We'll need to pull the data. I'll have an answer for you by Friday."
Why it happens: The necessary information exists but requires manual data collection and consolidation from multiple, disconnected sources. This tedious process is slow and highly susceptible to human error.
The hidden cost: The business world moves fast. By the time you get the answer, the opportunity to act on it has often passed. This reactive approach prevents you from making agile, proactive decisions.
4. You Can't Answer Simple Business Questions Quickly
The Sign: A critical question like, "Which products are most frequently abandoned in online carts but later purchased in our physical stores?" requires a formal request to the IT department or a Data Scientist.
Why it happens: The data exists, but it is not structured or accessible in a way that allows for natural language queries or simple exploration. It is locked away in complex databases that are indecipherable to the average business user.
The hidden cost: Your business becomes slow and unresponsive. While you wait for an answer, agile competitors who can access Real-Time Insights are already adapting to changing customer behavior and capturing market share.
5. Data Projects Never Seem to Finish
The Sign: Your major data integration or analytics implementation project has been "90% complete" for the last six months, with goalposts that seem to constantly shift.
Why it happens: These projects are often plagued by unrealistic scope, unforeseen technical complexities in connecting legacy systems, and a lack of clear business objectives from the outset.
The hidden cost: You continue to burn budget on an incomplete solution while the entire organization remains reliant on outdated, inefficient decision-making processes.
6. Executives Don't Reference Analytics in Strategic Discussions
The Sign: During high-stakes board meetings or strategy sessions, leadership relies on broad industry reports and third-party market research instead of your own internal customer data.
Why it happens: The internal data is perceived as untrustworthy, incomplete, or too difficult to access and interpret for high-level decision-making. Executives lack confidence in its accuracy.
The hidden cost: Your overarching business strategy is based on generic market conditions rather than the specific, nuanced behavior of your own customers, leading to poorly targeted initiatives.
7. You're Surprised by Customer Behavior Changes
The Sign: A sudden drop in sales for a key product line or an unexpected shift in purchasing patterns catches your entire team off guard, despite having a "comprehensive" suite of analytics tools.
Why it happens: Your analytics are set up for reactive reporting (what happened last month) instead of proactive, predictive monitoring. You lack the predictive analytics capabilities to identify subtle trends and forecast future shifts.
The hidden cost: Competitors who can spot these trends earlier are better positioned to adapt their Product Development and marketing strategies, effectively capturing the market share you lose.
How Good Data Actually Drives Growth
Effective omnichannel analytics doesn't just report on what happened; it provides a clear, unified narrative that guides what should happen next. It transforms data from a confusing liability into your most valuable strategic asset.
Accessible Intelligence Through a Unified View
The future of business analytics isn't about more complex dashboards; it's about creating a single source of truth that delivers conversational intelligence. This allows business teams to ask critical, cross-channel questions in plain language:
- "Show me the complete journey of customers who saw a social media ad, visited our website, and then made a purchase in-store."
- "What marketing channels brought us the most loyal customers with the highest lifetime value last quarter?"
- "Which customer segments are showing decreased customer engagement and are at risk of churning?"
This approach removes the technical barriers that prevent most teams from using data effectively. When insights are this accessible, they become embedded in the daily workflow, fostering a genuine data-driven culture. This integrated view is essential for enhancing the overall customer experience and boosting Customer Satisfaction. In fact, omnichannel service boosts Customer Satisfaction (CSAT) to 67%, compared to just 28% for multichannel approaches, according to a report from Plivo.
Real-Time Decision Support
Good analytics provide Real-Time Insights that empower proactive decision-making. Instead of waiting weeks for a report, teams can instantly see how a campaign is performing and make adjustments on the fly. This agility is crucial in a market where customer preferences and market conditions can change overnight. It enables powerful capabilities like personalized marketing at scale, ensuring the right message reaches the right customer on the right channel at the right time.
The "CEO-Ready Insights" Framework
Data is useless if it doesn't lead to action. The key is to translate complex data analysis into concise, impactful recommendations.
Instead of: "Our conversion rates improved 12% month-over-month across digital channels, with mobile showing particularly strong performance in the 25-34 demographic after we optimized the checkout flow."
CEO-Ready Version: "Mobile customers aged 25-34 are our key growth driver. They convert 40% better and spend 25% more per order. We recommend shifting 30% of our ad budget to mobile-first campaigns targeting this segment to generate an estimated $500k in additional revenue this quarter."
The difference: The second version moves beyond observation to a specific, measurable recommendation with a clear business impact. This is the essence of effective data-driven decision-making.
Audit Your Current Analytics
Before you can fix the problem, you need to understand its scope. Ask your team these honest questions:
- When was the last time a significant business decision was made based on a specific insight from our analytics?
- How many analytics tools do we pay for that are rarely or never used by business teams?
- What are the top three most important business questions that we currently cannot answer quickly and confidently?
Implement the "One Source of Truth" Rule
To eliminate confusion and conflicting reports, you must establish a single, trusted source for your key performance indicators. This requires robust data collection and integration processes.
Choose one primary, clearly defined metric for each core business area:
- Revenue: One universally agreed-upon calculation for revenue growth, not five different versions from five different systems.
- Customer Satisfaction: One primary score (like NPS or CSAT), not multiple conflicting Customer Feedback metrics.
- Marketing ROI: A standardized model for calculating return on investment, not separate, inconsistent calculations for each channel.
Test the Plain-English Standard
The ultimate test of your analytics system's usability is its accessibility to non-technical users.
Challenge: Can a marketing manager or a product lead get answers to basic business questions about customer behavior without needing help from an analyst or a Data Scientist?
If the answer is no, you should consider tools that translate complex data into natural language responses and intuitive visualizations.
Establish Weekly "Data Check-ins"
Foster a data-driven culture by making data a central part of your weekly operational rhythm. Hold brief, 30-minute sessions where teams review:
- What key decisions were influenced by data this week?
- What important questions could we not answer quickly?
- Which insights led to specific, tangible actions and what were the results?
Start with Your Most Important Question
Instead of attempting a massive, all-encompassing overhaul, focus your efforts on solving one high-impact problem first. Identify the single business question that, if answered accurately, would have the greatest positive impact on your growth. This could be a question related to marketing, sales, or Product Development.
For an omnichannel business, this might be:
- "Which online marketing campaigns are most effective at driving high-value, in-store purchases?"
- "What is the ideal inventory allocation between our e-commerce warehouse and physical stores to minimize stockouts?"
- "Which personalized marketing messages are most effective for converting first-time visitors into repeat customers?"
FAQ
Q: How do I know if our data quality is actually the problem?
A: Run this simple test: Ask three different team members to pull the same metric (like monthly revenue growth). If you get three different answers, data quality and accessibility are issues. Also, track how often strategic decisions get delayed while "waiting for data analysis."
Q: What's the difference between having lots of data and having useful insights?
A: Data is raw information (like "1,247 customers bought products last week"). Insights answer business questions (like "customers who buy on mobile spend 23% more and prefer weekend delivery"). If your team spends more time organizing data than discussing what it means for business strategy, you have a data problem, not an insights advantage.
Q: How can I justify replacing analytics tools that we've already invested in?
A: Calculate the hidden costs of your current setup: hours spent manually combining data, decisions delayed while waiting for reports, and opportunities missed due to slow insights. Often, the productivity gains from accessible analytics pay for new tools within months. Focus on ROI, not sunk costs.
Q: Should we hire more data analysts or invest in better tools?
A: Consider this: if your current tools require specialized skills to use, hiring more analysts just scales the problem. Better tools that business teams can use directly often provide faster ROI than expanding technical staff. The goal is democratizing insights, not building a bigger analytics department.
Q: How do we handle data from multiple countries with different regulations?
A: Start with data governance frameworks that respect local regulations while enabling regional insights. Many Southeast Asian businesses successfully use cloud-based analytics that can segment data by jurisdiction while providing unified reporting. Consult with local compliance experts, but don't let regulatory complexity prevent you from using data strategically.
Q: What's the first sign that our analytics investment is paying off?
A: Business teams start referencing data insights in daily conversations without prompting. When marketing says "our Jakarta customers prefer email over SMS based on last month's response rates" naturally in planning meetings, you know analytics are becoming part of decision-making culture rather than a separate technical process.
Ready to stop wrestling with dashboards and start getting clear answers?
The most successful omnichannel retailers in Southeast Asia are moving beyond traditional analytics toward AI-native platforms that understand business questions in plain English. Instead of training teams on complex tools, they're implementing systems where asking "Which products should we promote during the next shopping festival?" gets immediate, actionable answers.
This shift from dashboard complexity to conversational insights is becoming the new competitive advantage in data-driven growth.
Explore how AI-native analytics can transform scattered data into executive-ready insights that actually drive business decisions.